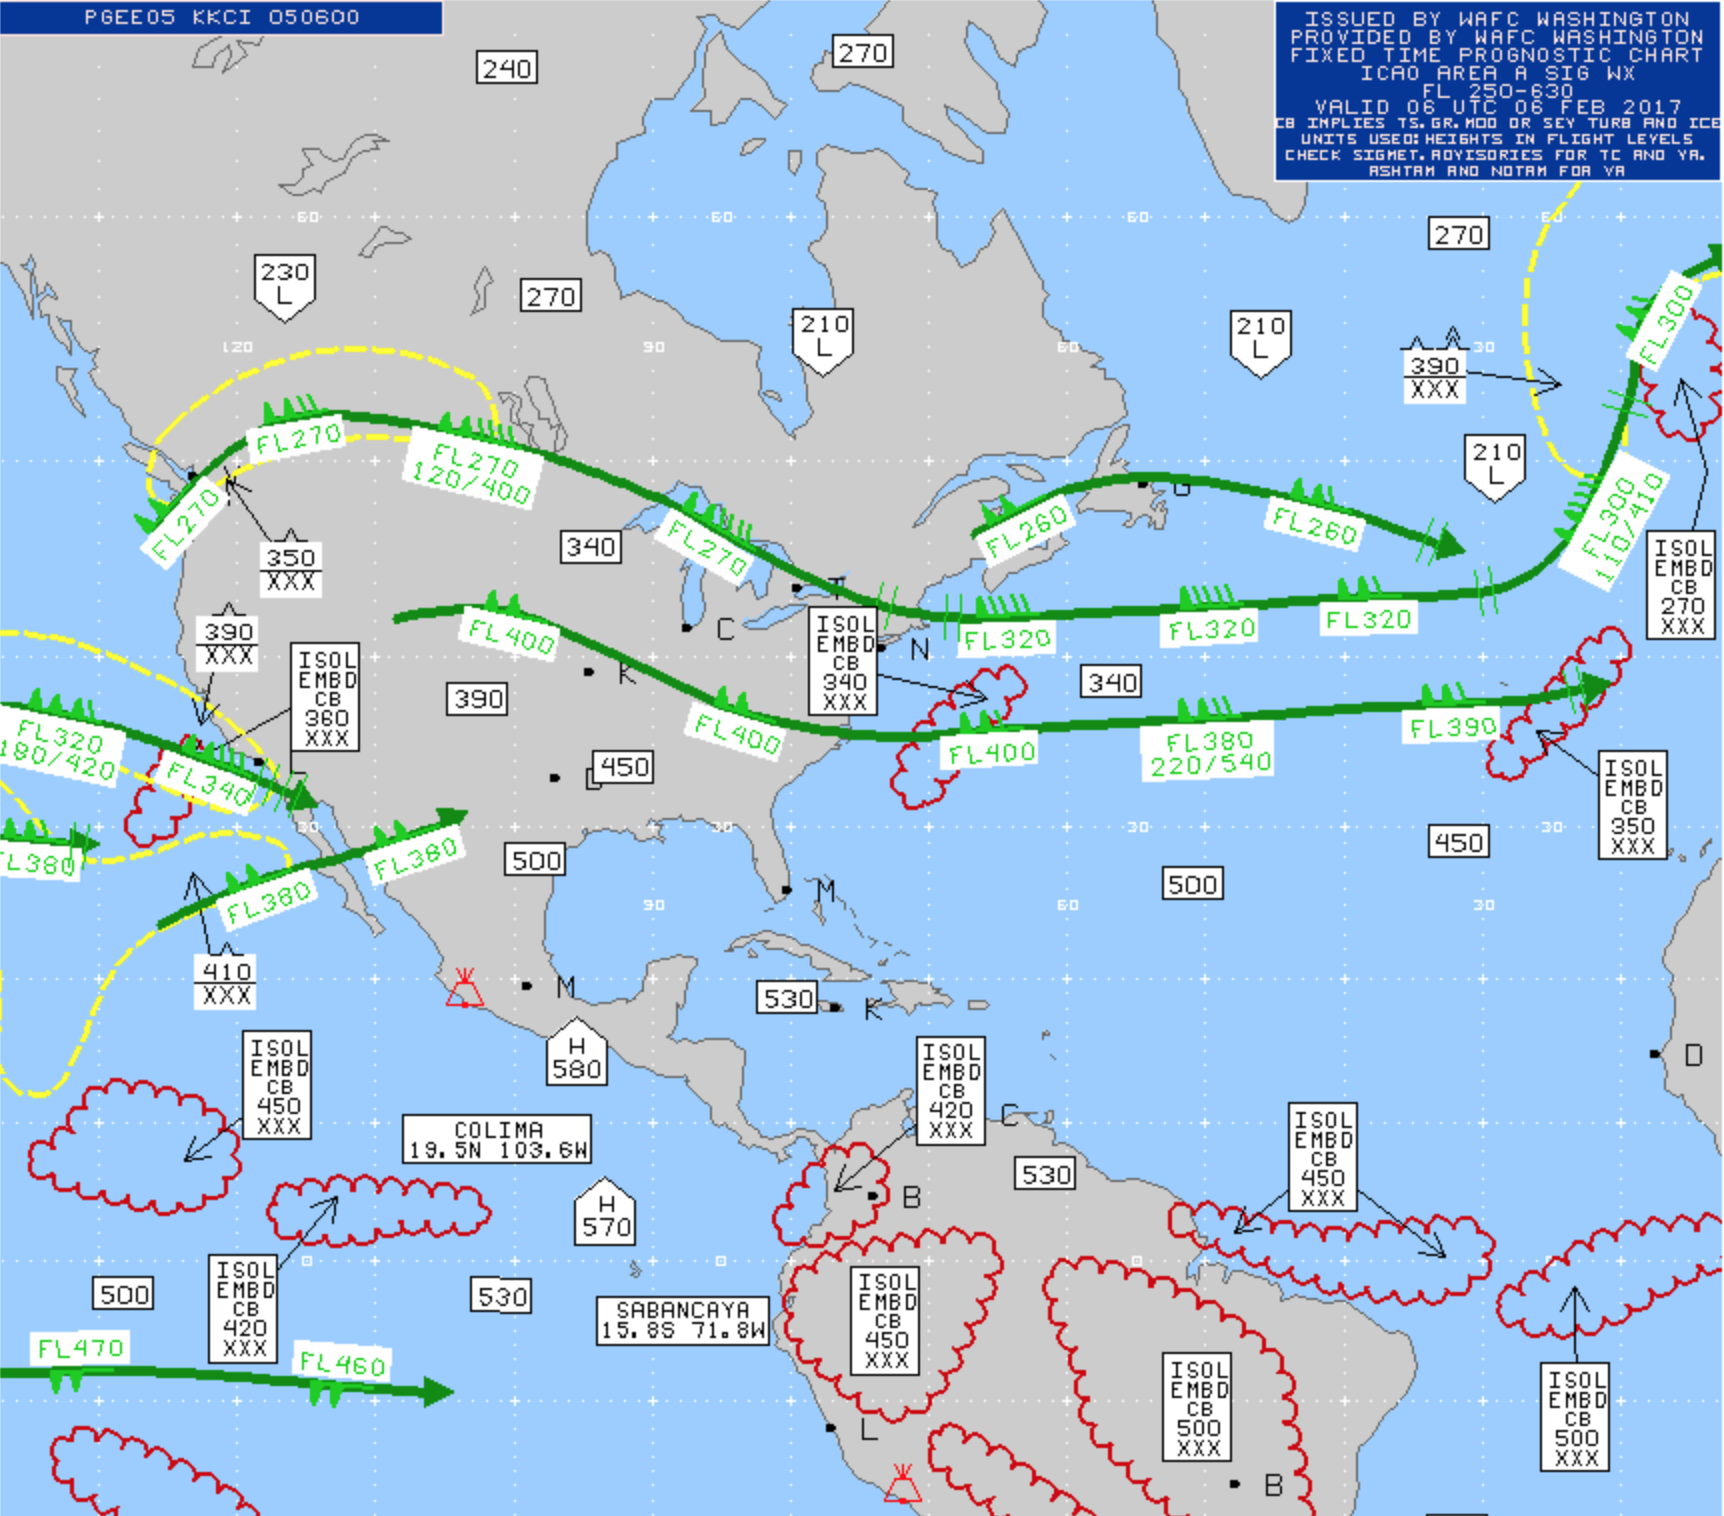
High-Level SigWx Chart
High-Level Significant Weather Prognostic charts (SIGWX) High Level Charts are graphic representations of forecasted significant weather on a global scale. The SIGWX High Level Charts indicate the 24-hour future position of jet streams, tropopause heights, convection, turbulence, and fronts. High level SIGWX charts are valid at specific fixed times: 0000, 0600, 1200, and 1800 UTC. They show significant en-route weather phenomena over a range of flight levels from 250 to 630, and associated surface weather features.

